Summary
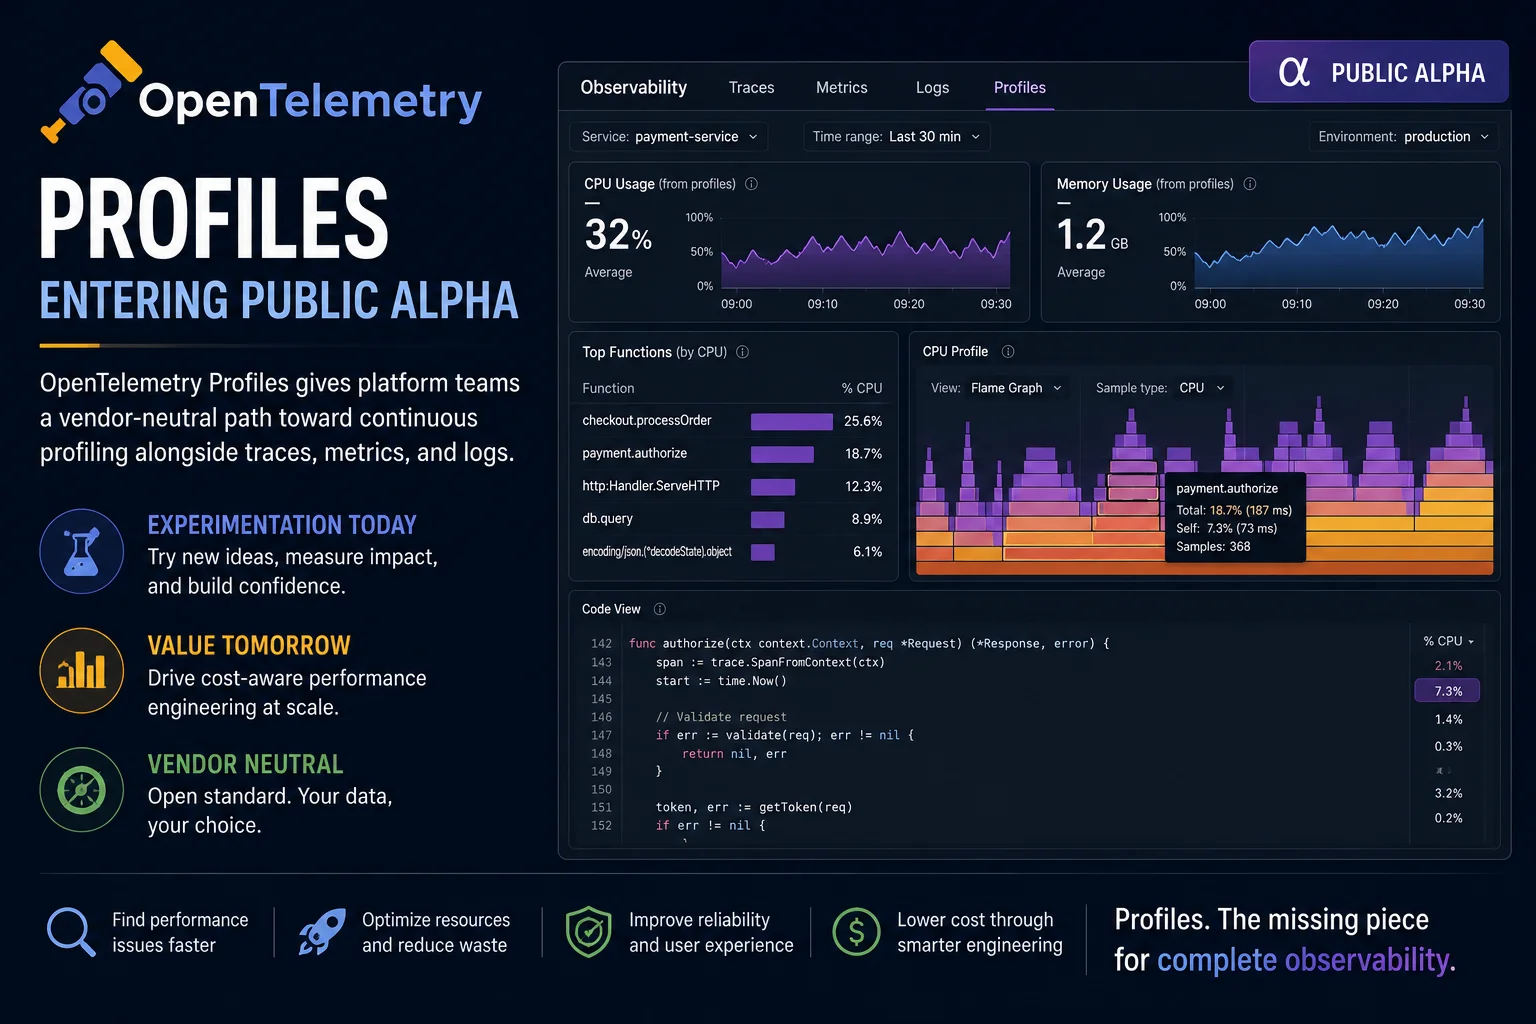
OpenTelemetry Profiles entering public Alpha is a meaningful development for enterprise observability, but not because every production environment should enable it tomorrow. Its importance is architectural. Profiles create a path for continuous production profiling to sit beside traces, metrics, and logs as a standard telemetry signal rather than a vendor-specific diagnostic feature.
For platform teams, that matters because performance problems are increasingly infrastructure problems. A slow service may be blocked on CPU contention, allocator behavior, kernel scheduling, runtime pauses, noisy neighbors, inefficient serialization, or a sidecar that became expensive under load. Traditional telemetry can show that latency increased or CPU usage rose. Profiles can show where execution time is actually going.
The Alpha label is important. This is a time for lab deployments, non-critical workloads, pipeline testing, and data-model feedback. It is not a reason to attach a new profiler blindly to critical systems. But it is a strong signal that profiling is becoming part of the standard observability contract.
What OpenTelemetry Profiles adds
OpenTelemetry began with traces and metrics, then expanded its role around logs and broader telemetry pipelines. Profiles extend that model into sampled execution data: call stacks, CPU time, off-CPU behavior, and runtime-specific performance information. Instead of treating profiling as a separate tool used only during incidents, the OpenTelemetry approach aims to make profiling data portable, correlated, and processable through familiar telemetry infrastructure.
The public Alpha includes several pieces that matter to infrastructure teams. OpenTelemetry describes a unified profiling data representation compatible with existing formats such as pprof. It includes work on efficient encoding through deduplicated stacks and dictionary tables. It supports resource attributes so profile data can be associated with the same host, service, container, or Kubernetes metadata used by logs, metrics, and traces. It also allows samples to be associated with trace and span identifiers, creating a route toward cross-signal analysis.
That last point is the operational hook. If a service’s p99 latency regresses after a rollout, traces can identify affected request paths, metrics can show saturation, logs can expose errors, and profiles can show which functions consumed CPU or blocked. The value is not just another chart. It is reducing the gap between symptom and cause.
Why continuous profiling has been hard to standardize
Production profiling is not new. Large engineering organizations have used low-overhead profilers for decades to reduce compute cost and diagnose performance regressions. The problem is that tooling has been fragmented. Different runtimes have different formats. Native code, Go, Java, Python, Node.js, .NET, Ruby, and BEAM applications expose different stack behavior. Some profilers focus on CPU. Others emphasize allocation, wall time, locks, or off-CPU events. Backends store and visualize data differently.
That fragmentation creates lock-in and operational overhead. A platform team may standardize on OpenTelemetry for metrics and traces, but still depend on a separate proprietary profiling agent and backend. Developers then have to jump between interfaces, reconcile labels, and manually connect a trace to a flame graph. Procurement and compliance teams also have to evaluate another data pipeline with its own access controls and retention model.
A vendor-neutral signal does not solve every profiling problem, but it gives the ecosystem a common target. Tools can emit OTLP Profiles. Collectors can receive and process profile data. Backends can compete on analysis and storage rather than on private wire formats. That is the same pattern that made OpenTelemetry important for traces and metrics.
The eBPF angle is practical, not magic
The Alpha announcement highlights an eBPF-based profiling agent and its integration with the OpenTelemetry Collector. For Linux infrastructure teams, eBPF matters because it can observe behavior at the system level with less application instrumentation than traditional profilers. That is especially useful in polyglot environments where teams run a mix of Go services, JVM workloads, Node.js APIs, .NET applications, Ruby services, and native components.
OpenTelemetry notes improvements including Collector receiver integration, automatic on-target symbolization for Go executables, ARM64 support for Node.js V8, initial BEAM support, .NET 9 and 10 support, and fixes for Ruby unwinding and symbolization. Those are practical details. Profiling is only useful when stacks are intelligible. A profiler that produces unresolved addresses or misleading frames creates noise, not insight.
At the same time, eBPF should be treated with engineering discipline. Kernel versions, security policy, container isolation, symbol access, runtime behavior, and overhead budgets all matter. Teams should test representative hosts rather than assuming portability across every fleet. They should also decide which profile types are acceptable, how long data is retained, and who can access it.
Cost visibility becomes more actionable
One reason profiles belong in enterprise observability is cost. Cloud and data center spending are increasingly shaped by inefficient software behavior. An application that burns 15 percent more CPU after a dependency change may not trigger an outage, but across hundreds of nodes it becomes real money. A service that allocates excessively may force larger instances. A batch job that spends time in compression, serialization, or lock contention may extend expensive compute windows.
Metrics can show resource consumption, but they rarely show why. Profiles provide the missing attribution. They let teams ask which functions, libraries, runtimes, or code paths account for CPU time under real traffic. That makes performance work easier to prioritize. Instead of guessing, teams can target the hottest paths with measurable cost impact.
This is especially relevant for AI and data-heavy platforms where supporting services, gateways, feature stores, vector databases, schedulers, and control planes can become expensive even when accelerators dominate the headline budget. Optimizing GPU utilization while ignoring CPU-heavy orchestration or inefficient API layers leaves money on the table.
What platform teams should test first
Because Profiles is Alpha, the right adoption path is controlled experimentation. A good first pilot is a non-critical Linux service with known traffic, existing OpenTelemetry instrumentation, and a team willing to compare profile data with current traces and metrics. The goal is not to replace the existing profiler immediately. The goal is to validate whether OpenTelemetry Profiles improves correlation and operational workflow.
A pilot should answer concrete questions. Can the Collector receive and route profile data reliably? Are Kubernetes attributes attached correctly? Are stacks symbolized well enough for developers to act on them? Does the added overhead stay within budget? Can sensitive paths be filtered? Does retention need to differ from metrics or traces? Can profiles be linked to deploy events, incidents, and service ownership?
Teams should also test failure modes. What happens when the backend is unavailable? Does the profiler drop data safely? Does it generate unexpected host load? Are security controls compatible with eBPF requirements? Is profile data covered by existing telemetry governance, or does it expose new sensitive information such as code paths, customer-specific execution patterns, or proprietary algorithms?
Governance matters as much as tooling
Profiles can reveal details that logs and metrics do not. Function names, stack traces, symbols, and runtime behavior may expose proprietary implementation details. In regulated environments, profiling data might also indirectly reveal workload characteristics that require access control. Treating profiles as “just performance data” is too casual.
Enterprises should define retention, redaction, access policy, and environment boundaries before expanding collection. Production profiling should have documented overhead targets and change-control expectations. Platform teams should publish guidance for service owners: when profiling is enabled, what is collected, how to inspect it, and how to request exclusions.
That governance work is easier if profiles use the same collection and policy infrastructure as other telemetry. This is where OpenTelemetry’s approach becomes valuable. A common pipeline allows consistent processing, filtering, enrichment, and routing, even if different backends are used for analysis.
The broader signal
OpenTelemetry’s 2026 activity shows an ecosystem moving beyond basic instrumentation. Recent project work covers entity events, metric cardinality limits, Linux host setup, and the implications of CNCF graduation. Profiles fit that trajectory. Observability is becoming less about collecting more data and more about creating a coherent operational model of systems, workloads, and cost.
The useful takeaway is restrained. Profiles will not automatically fix performance engineering. Alpha maturity means APIs, implementations, and backend support can change. Critical production reliance would be premature. But ignoring the signal would also be a mistake. Vendor-neutral profiling is likely to influence how enterprises design telemetry pipelines, incident response, capacity planning, and cost optimization.
The enterprise takeaway
OpenTelemetry Profiles gives infrastructure teams a credible direction for making production performance a first-class signal. The immediate work is evaluation: test the data model, understand eBPF operational requirements, validate Collector pipelines, and define governance. The longer-term opportunity is more significant. If profiles become as portable and correlated as traces and metrics, performance engineering can move from occasional firefighting to continuous operational practice.